Impact maps of current activities. Immission maps: average and maximum values (episodes)
The generation of immission maps requires having reliable databases of:
- Emission levels databases. Emission factors determined directly from the chimneys and/or diffuse positions
- Orographic databases
- Surface and mesoescalar (satelite data) meteorological databases
The abovementioned data allow the realization of the following immission maps:
- 98-percentile maps of the average hourly data through the year
- 98-percentile maps of the average hourly data for the different months of the year
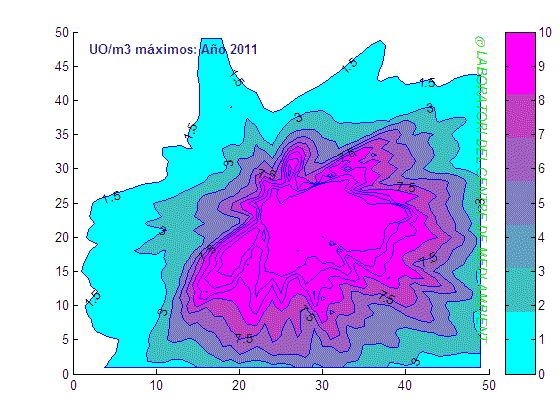
- Maximum annual values maps
- Maximum mensal values maps
- Maximum and minimum values for hourly slot maps
- Evolution of the emissions impact throughout the 24 hours of the day
The emission factors obtained directly from the emission sources with chemical control enable a higher reliability in the emission impact maps determined through numerical modelling.
Determination of emission levels through a direct measure in the emission sources |
Surface emission determination in a landfill |
Maximum values impact map (odour units/m3) of an urban solid waste treatment facility |
Impact map of a future deposit of urban solid waste (odour units/m3) |


Share: